The field of medicine deals with a large amount of complex data: test results, the number of cases, epidemiological forecasts, and so on. How do you take this into account and present the figures in a user-friendly manner? Data visualization tools come in handy in this regard.
In this article, we will discuss the methods and benefits of data visualization in healthcare organizations that lead to increased patient awareness.
Importance of Data Visualization
Data visualization in the healthcare industry saves time, helps identify patterns, educates patients, and facilitates a data-driven decision-making process. Key challenges in working with medical data visualization include integrating data from multiple sources, security protocols, and methods of interpretation.
Learn how to simplify your practice workflow and free up more time for patients with Medesk.
Open the detailed description >>Data visualization is a way of organizing complex data into simple and understandable graphical elements. This method helps demonstrate the relationship between different indicators, track information in real-time, and make more informed decisions.
Key aspects include:
Enhanced Decision-Making
- Data visualization tools allow healthcare professionals to analyze large and complex datasets efficiently and discover correlations in the data.
- Visualization tools enable real-time monitoring of patient data, allowing healthcare providers to respond promptly to changes in a patient's condition or to emerging health trends in a population.
Improved Communication
- Visual representations of medical information make it easier for healthcare providers to explain complex concepts to patients.
- Visualization tools facilitate communication and collaboration among different healthcare professionals.
Identifying Trends and Outliers
- Data visualization aids in the early detection of disease outbreaks, trends, or anomalies.
- By visualizing performance metrics and outcomes, medical professionals can identify areas for improvement in patient care, clinical processes, and overall healthcare delivery.
Patient Outcomes and Population Health
- Data visualization assists in tracking patient outcomes and assessing the effectiveness of different treatment strategies.
- Visualizing patient health data helps healthcare providers and policymakers understand the health status of communities, identify health disparities, and develop targeted interventions to improve public health.
Compliance and Reporting
Data visualization tools help healthcare organizations comply with regulatory requirements by providing a clear and concise presentation of compliance metrics.
Medesk helps automate scheduling and record-keeping, allowing you to recreate an individual approach to each patient, providing them with maximum attention.
Learn more >>Examples of data visualization include:
- interactive dashboards
- infographics
- interactive maps
- graphs
- and charts.
How Data Visualization is Used in Healthcare
Imagine a scenario in your medical practice with 50 individuals, each undergoing genetic testing for 10 distinct markers. This results in a wealth of 500 unique data points, not to mention additional tests or cases with a more extensive client base. Organizing this information is crucial for the ease of access for doctors, administrators, and patients alike.
There are several ways to visualize such information in medical applications and on web portals.
Patient outcome dashboards. Healthcare systems use data visualization to create dashboards that track patient outcomes over time. This allows clinicians to monitor treatment effectiveness, identify trends, and adjust care plans for better outcomes.
Epidemiological mapping. Visualizing disease spread through interactive maps helps public health officials analyze and respond to epidemics. This enables timely interventions, resource allocation, and communication strategies to control the spread of infections.
Operational efficiency analytics. Hospitals utilize data visualization to optimize operational processes. Visual analytics tools can analyze patient flow, bed occupancy rates, and resource utilization, leading to improved efficiency, reduced wait times, and better resource allocation.
Widgets. Consider a situation where a health app employs interactive widgets. These graphical elements allow users to monitor real-time fitness metrics, such as steps taken, heart rate, and sleep patterns. Widgets offer a convenient way for individuals to engage with their health data, promoting a proactive approach to well-being.
Infographics for Visualizing Medical Data
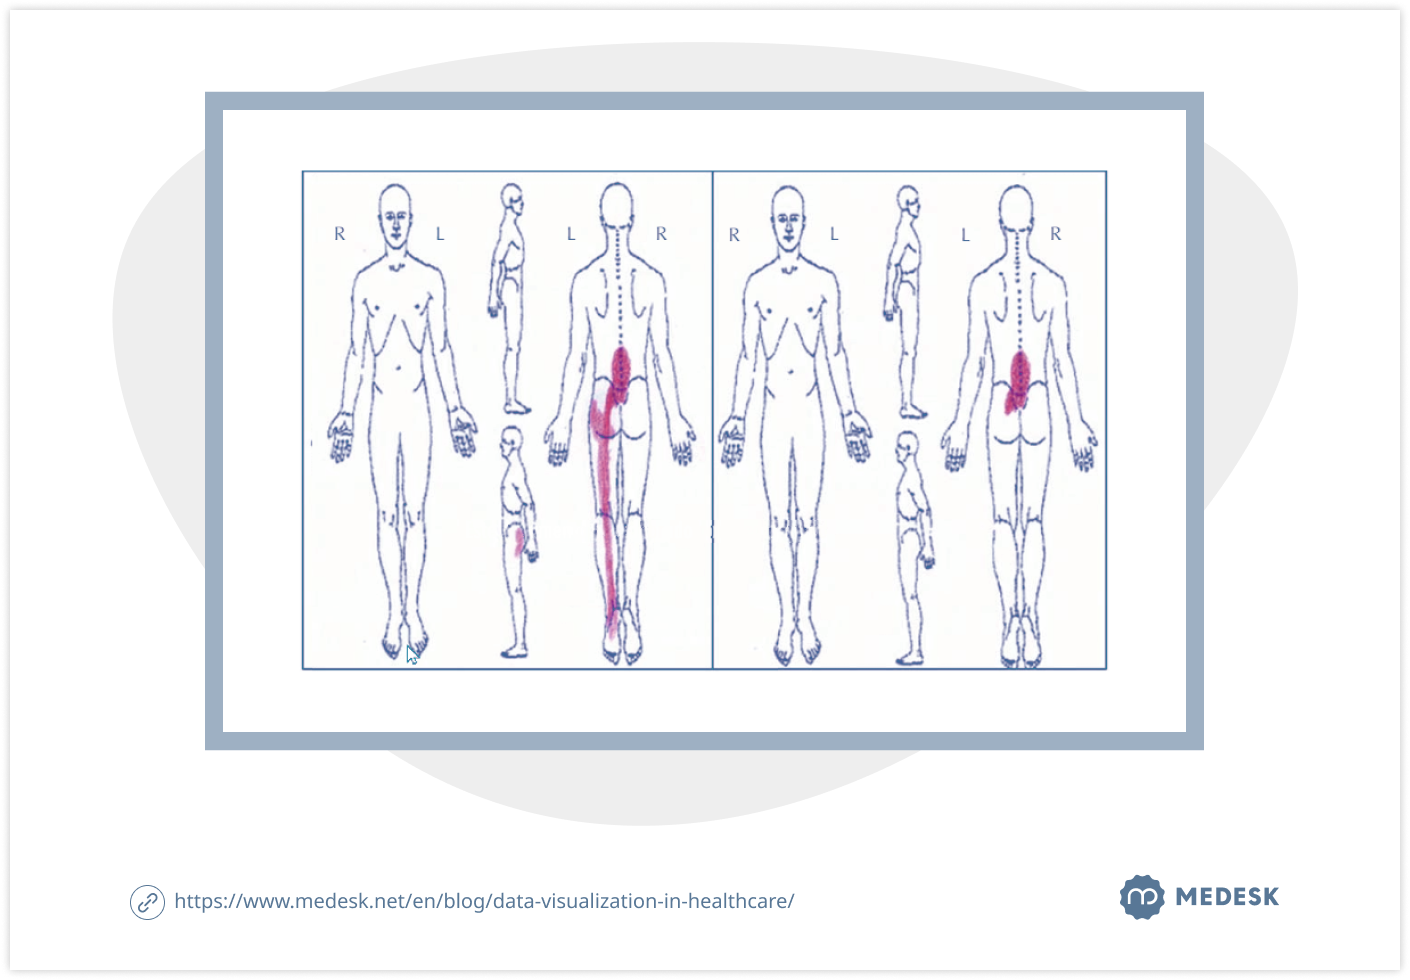
Infographics are an effective way to visualize medical data. Doctors and patients can easily understand complex medical concepts, such as disease prevalence, causes, and treatments, through graphical images and diagrams.

Benefits of using infographics in medicine include:
- Facilitating the understanding of complex concepts
- Improving communication between doctors and patients
- Assisting in making important medical decisions
- Enhancing health literacy among patients
Examples of Using Infographics in Medicine
Infographics can be utilized in medicine to visualize various types of data:
- Statistical data on disease prevalence and mortality
- Information about medications and therapeutic procedures
- Data explaining diseases such as diabetes or cancer
Creating Infographics is an effective means of Visualizing medical data that can improve understanding and communication between doctors and patients, as well as aid in making crucial medical decisions. Its use in medicine can be beneficial for both healthcare professionals and patients.
Discover more about the essential features of Medesk and claim your free access today!
Explore now >>Posters in Hallways and Doctors' Offices: a Thing of the Past?
We believe that this is not the case. The purpose of any educational medical material with illustrations is to show how the human body is organized, what happens with various diseases, how to avoid risks, and how to strengthen health. There is a vast amount of educational material on various topics: symptoms of diseases, prevention, hygiene compliance, advocating for a healthy lifestyle, and more. With their help, a doctor during a consultation can visually demonstrate to the patient what is happening in their body and what processes are underway.

According to research by 3M, we perceive visual information 60,000 times faster than text.
Two important factors help enhance the impact on a person's consciousness through an illustrated guide:
- High-quality image and execution of the poster;
- The underlying message should be easily understood.
Medical posters can be divided into several conditional groups:
- Tables with calculations (e.g., calorie counting, food compatibility, vitamin content, etc.);
- Diagnostic diagrams (serve as educational material for medical schools or as a reference);
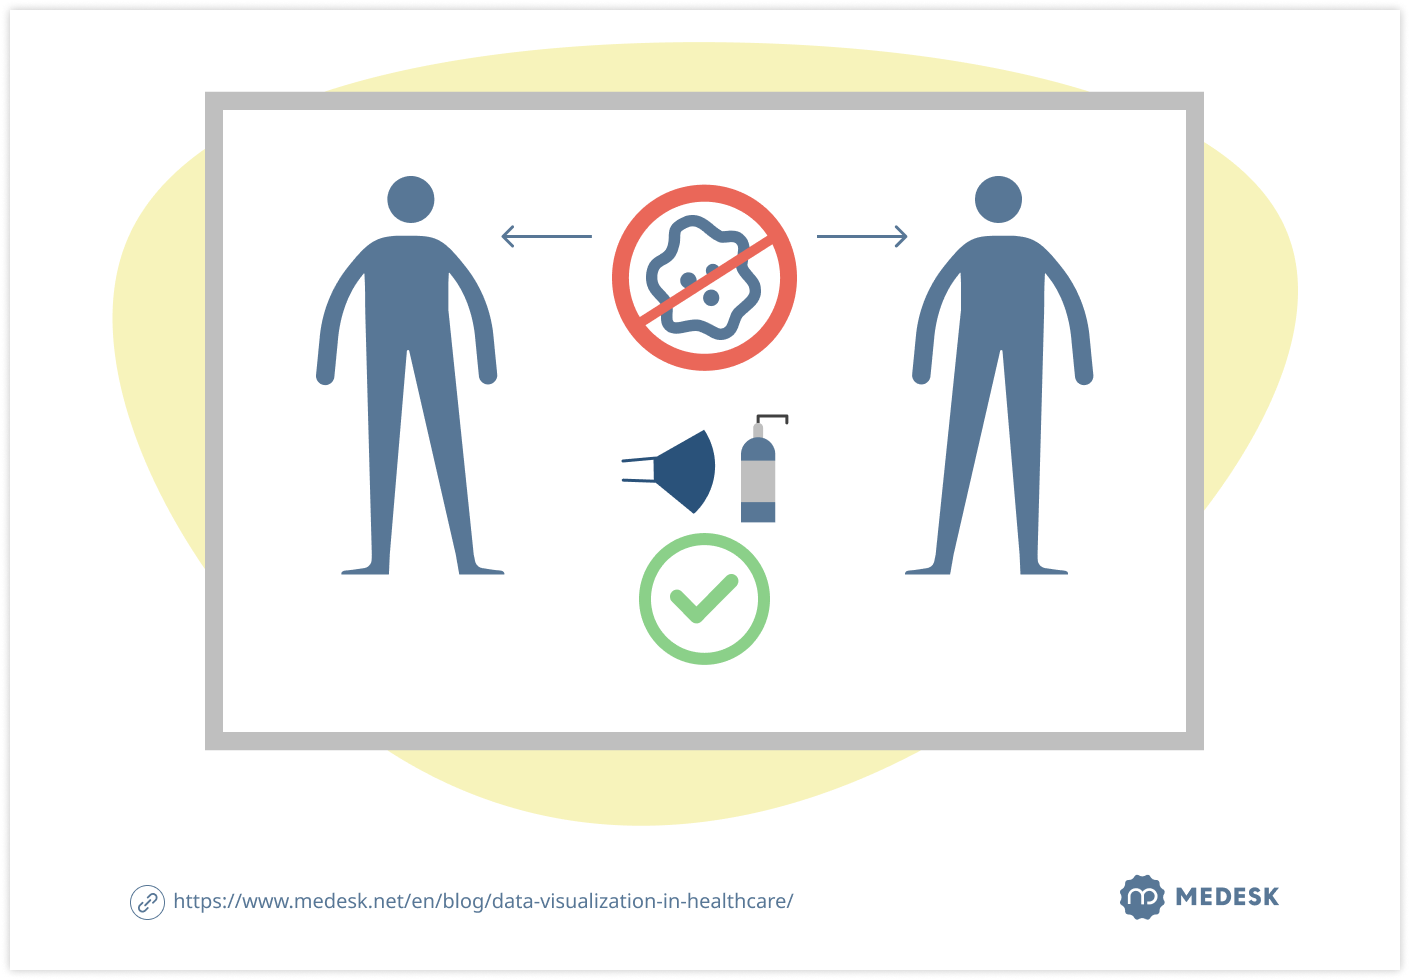
- Prevention methods (useful tips on how to avoid diseases, strengthen immunity, etc.);
- Illustrations of organs and the human body.
Combined posters that simultaneously serve educational and informative functions look most advantageous and effective. Medical posters are suitable for informing both patients and practicing doctors.
Where is the best place to display posters?
You can hang them in hallways, waiting rooms, and near doctors' offices. Posters should be at eye level for visitors to read comfortably, taking into account the average height of a person (165–175 cm).
Graphical Reports on the Clinical Data and Performance
Alongside the conventional format of reports for doctors, tables, here is the graphical representation of information. Graphical representation offers several advantages:
- More visually intuitive display of data.
- Presence of gradient areas.
- Various types of graphical representation (histograms, diagrams, and three-dimensional graphics).
- Higher degree of real-time data analysis and comparison.
The primary challenges in displaying data in graphical form involve considering human visual perception and applying cognitive graphics. The following questions arise:
- Choice of graph type: why a particular type of diagram and not another?
- Choice of colour: why a specific colour?
- Choice of colour for an area in graphical representation: how does the choice of colour depend on the semantic load of the area?
Partially, such questions can be attributed to interface design using indicators. Questions also arise about the arrangement of graphical forms in relation to each other, as it is common to display data simultaneously for multiple indicators. It should be noted that each indicator requires individual customization and representation.
Practice management software takes into account all the nuances of data visualization techniques, using a vast array of filters and categorizing all data. Visual reports are generated within seconds, allowing you to thoroughly analyze any aspect of the clinic's operations.
![[en] donut reports](https://www.medesk.net/q2vojxd7ywwe/2MxWLsCzPHsQkGQywbKqzE/c6b9dcdb7561542cf9c534faf831913e/stat-state1-OUT-v1-UK__1_.png)
Electronic health records (EHR) are a crucial source of information for future visualization. We are working to ensure that the system not only digitizes and accumulates information but also has the capability to:
- Standardize data into a unified format
- Visualize data in the form of beautiful and comprehensible graphs
- Identify correlations between different indicators
- Make assumptions about a person's health status, which should be verified during consultations with a doctor (the presence of a correlation does not necessarily imply a cause-and-effect relationship)
- Notify the patient, doctor, or family member of any deviations from the norm.

How to Implement Data Visualization in Healthcare Sector
To integrate data visualization into your clinic's operations, a strategic planning process is essential.
Begin by identifying crucial data sources and specific metrics required by physicians, administrators, and patients. Collaborate with medical staff to understand their needs, ensuring the development of an efficient and user-friendly interface.
Next, select visualization elements such as graphs, charts, interactive maps, and dashboards to comprehensively represent the necessary data.
Configure data exchange with existing medical technologies, adhering to data security protocols and confidentiality. Focus on the user experience, crafting an intuitively understandable interface with customization options.
Regularly collect user feedback to enhance the service and adjust the data to evolving requirements and trends.
AI and the Future of Healthcare Data Visualization Tools
Thanks to increased productivity and accuracy, as well as a more personalized experience, AI is fundamentally changing the quality of image processing in medicine.
According to Signify Research, by 2023, the global AI market for medical visualization, including software for automatic detection, quantitative assessment, decision support, and diagnostics, will reach 2 billion US dollars.
AI technologies used in medical image processing include deep learning, machine learning, augmented reality, intelligent data analysis, and more. These technologies help achieve various goals in disease screening, diagnosis, medical surgery, etc.
Artificial intelligence technologies, such as machine learning and deep learning, are used in the intelligent analysis of data from images processed by computer vision technologies, such as image registration and fusion. They can assist doctors in annotating medical images, diagnosing diseases, and performing surgery.
Deep learning surpasses machine learning in disease diagnosis. Conventional computer-aided diagnosis (CAD) methods are mostly based on machine learning or expert systems and are criticized for being performed mechanically or being ineffective. However, deep learning algorithms have proven to be more efficient and can more comprehensively process medical data, extracting useful information and identifying key disease moments, freeing doctors from labour-intensive clinical work.
Trends and Limitations of AI in Medical Visualization
The medical visualization market has embraced artificial intelligence technology as it can reduce inefficiency and save time for doctors. However, there are also factors limiting the practical application of artificial intelligence in medical visualization. For instance, large volumes of medical visualization data are scattered across different hospitals, independent visualization centres, and research institutions, making it challenging to collect and efficiently utilize medical visualization data.


